120x ticker screener (composite tickers)In specific circumstances, it is possible to extract data, far above the 40 `request.*()` call limit for 1 single script .
The following technique uses composite tickers . Changing tickers needs to be done in the code itself as will be explained further.
⎯⎯⎯⎯⎯⎯⎯⎯⎯⎯⎯⎯⎯⎯⎯⎯⎯⎯⎯⎯⎯⎯⎯⎯⎯⎯⎯⎯⎯⎯⎯⎯⎯⎯⎯⎯⎯⎯⎯⎯⎯⎯⎯⎯⎯⎯⎯⎯⎯⎯⎯⎯⎯⎯⎯
🔶 PRINCIPLE
Standard example:
c1 = request.security('MTLUSDT' , 'D', close)
This will give the close value from 1 ticker (MTLUSDT); c1 for example is 1.153
Now let's add 2 tickers to MTLUSDT; XMRUSDT and ORNUSDT with, for example, values of 1.153 (I), 143.4 (II) and 0.8242 (III) respectively.
Just adding them up 'MTLUSDT+XMRUSDT+ORNUSDT' would give 145.3772 as a result, which is not something we can use...
Let's multiply ORNUSDT by 100 -> 14340
and multiply MTLUSDT by 1000000000 -> 1153000000 (from now, 10e8 will be used instead of 1000000000)
Then we make the sum.
When we put this in a security call (just the close value) we get:
c1 = request.security('MTLUSDT*10e8+XMRUSDT*100+ORNUSDT', 'D', close)
'MTLUSDT*10e8+XMRUSDT*100+ORNUSDT' -> 1153000000 + 14340 + 0.8242 = 1153014340.8242 (a)
This (a) will be split later on, for example:
1153014330.8242 / 10e8 = 1.1530143408242 -> round -> in this case to 1.153 (I), multiply again by 10e8 -> 1153000000.00 (b)
We subtract this from the initial number:
1153014340.8242 (a)
- 1153000000.0000 (b)
–––––––––––––––––
14340.8242 (c)
Then -> 14340.8242 / 100 = 143.408242 -> round -> 143.4 (II) -> multiply -> 14340.0000 (d)
-> subtract
14340.8242 (c)
- 14340.0000 (d)
––––––––––––
0.8242 (III)
Now we have split the number again into 3 tickers: 1.153 (I), 143.4 (II) and 0.8242 (III)
⎯⎯⎯⎯⎯⎯⎯⎯⎯⎯⎯⎯⎯⎯⎯⎯⎯⎯⎯⎯⎯⎯⎯⎯⎯⎯⎯⎯⎯⎯⎯⎯⎯⎯⎯⎯⎯⎯⎯⎯⎯⎯⎯⎯⎯⎯⎯⎯⎯⎯⎯⎯⎯⎯⎯
In this publication the function compose_3_() will make a composite ticker of 3 tickers, and the split_3_() function will split these 3 tickers again after passing 1 request.security() call.
In this example:
t46 = 'BINANCE:MTLUSDT', n46 = 10e8 , r46 = 3, t47 = 'BINANCE:XMRUSDT', n47 = 10e1, r47 = 1, t48 = 'BINANCE:ORNUSDT', r48 = 4 // T16
•••
T16= compose_3_(t48, t47, n47, t46, n46)
•••
= request.security(T16, res, )
•••
= split_3_(c16, n46, r46, n47, r47, r48)
🔶 CHANGING TICKERS
If you need to change tickers, you only have to change the first part of the script, USER DEFINED TICKERS
Back to our example, at line 26 in the code, you'll find:
t46 = 'BINANCE:MTLUSDT', n46 = 10e8 , r46 = 3, t47 = 'BINANCE:XMRUSDT', n47 = 10e1, r47 = 1, t48 = 'BINANCE:ORNUSDT', r48 = 4 // T16
( t46 , T16 ,... will be explained later)
You need to figure out how much you need to multiply each ticker, and the number for rounding, to get a good result.
In this case:
'BINANCE:MTLUSDT', multiply number = 10e8, round number is 3 (example value 1.153)
'BINANCE:XMRUSDT', multiply number = 10e1, round number is 1 (example value 143.4)
'BINANCE:ORNUSDT', NO multiply number, round number is 4 (example value 0.8242)
The value with most digits after the decimal point by preference is placed to the right side (ORNUSDT)
If you want to change these 3, how would you do so?
First pick your tickers and look for the round values, for example:
'MATICUSDT', example value = 0.5876 -> round -> 4
'LTCUSDT' , example value = 77.47 -> round -> 2
'ARBUSDT' , example value = 1.0231 -> round -> 4
Value with most digits after the decimal point -> MATIC or ARB, let's pick ARB to go on the right side, LTC at the left of ARB, and MATIC at the most left side.
-> 'MATICUSDT', LTCUSDT', ARBUSDT'
Then check with how much 'LTCUSDT' and 'MATICUSDT' needs to be multiplied to get this: 5876 0 7747 0 1.0231
'MATICUSDT' -> 10e10
'LTCUSDT' -> 10e3
Replace:
t46 = 'BINANCE:MTLUSDT', n46 = 10e8 , r46 = 3, t47 = 'BINANCE:XMRUSDT', n47 = 10e1, r47 = 1, t48 = 'BINANCE:ORNUSDT', r48 = 4 // T16
->
t46 = 'BINANCE:MATICUSDT', n46 = 10e10 , r46 = 4, t47 = 'BINANCE:LTCUSDT', n47 = 10e3, r47 = 2, t48 = 'BINANCE:ARBUSDT', r48 = 4 // T16
DO NOT change anything at t46, n46,... if you don't know what you're doing!
Only
• tickers ('BINANCE:MTLUSDT', 'BINANCE:XMRUSDT', 'BINANCE:ORNUSDT', ...),
• multiply numbers (10e8, 10e1, ...) and
• round numbers (3, 1, 4, ...)
should be changed.
There you go!
🔶 LIMITATIONS
🔹 The composite ticker fails when 1 of the 3 isn't in market in the weekend, while the other 2 are.
That is the reason all tickers are crypto. I think it is possible to combine stock,... tickers, but they have to share the same market hours.
🔹 The number cannot be as large as you want, the limit lays around 15-16 digits.
This means when you have for example 123, 45.67 and 0.000000000089, you'll get issues when composing to this:
-> 123045670.000000000089 (21 digits)
Make sure the numbers are close to each other as possible, with 1 zero (or 2) in between:
-> 1.230045670089 (13 digits by doing -> (123 * 10e-3) + (45.67 * 10e-7) + 0.000000000089)
🔹 This script contains examples of calculated values, % change, SMA, RMA and RSI.
These values need to be calculated from HTF close data at current TF (timeframe).
This gives challenges. For example the SMA / %change is not a problem (same values at 1h TF from Daily data).
RMA , RSI is not so easy though...
Daily values are rather similar on a 2-3h TF, but 1h TF and lower is quite different.
At the moment I haven't figured out why, if someone has an idea, don't hesitate to share.
The main goal of this publication is 'composite tickers ~ request.security()' though.
🔹 When a ticker value changes substantially (x10, x100), the multiply number needs to be adjusted accordingly.
🔶 SETTINGS
SHOW SETS
SET
• Length : length of SMA, RMA and RSI
• HTF : Higher TimeFrame (default Daily)
TABLE
• Size table : \ _ Self-explanatory
• Include exchange name : /
• Sort : If exchange names are shown, the exchanges will be sorted first
COLOURS
• CH%
• RSI
• SMA (RMA)
DEBUG
Remember t46 , T16 ,... ?
This can be used for debugging/checking
ALWAYS DISABLE " sort " when doing so.
Example:
Set string -> T1 (tickers FIL, CAKE, SOL)
(Numbers are slightly different due to time passing by between screen captures)
Placing your tickers at the side panel makes it easy to compare with the printed label below the table (right side, 332201415014.45 ),
together with the line T1 in the script:
t1 = 'BINANCE:FILUSDT' , n1 = 10e10, r1 = 4, t2 = 'BINANCE:CAKEUSDT' , n2 = 10e5 , r2 = 3, t3 = 'BINANCE:SOLUSDT' , r3 = 2 // T1
FIL : 3.322
CAKE: 1.415
SOL : 14.56
Now it is easy to check whether the tickers are placed close enough to each other, with 1-2 zero's in between.
If you want to check a specific ticker, use " Show Ticker" , see out initial example:
Set string -> T16
Show ticker -> 46 (in the code -> t46 = 'BINANCE:MTLUSDT')
(Set at 0 to disable " check string " and NONE to disable " Set string ")
-> Debug/check/set away! 😀
🔶 OTHER TECHNIQUES
• REGEX ( Regular expression ) and str.match() is used to delete the exchange name from the ticker, in other words, everything before ":" is deleted by following regex:
exch(t) => incl_exch ? t : str.match(t, "(?<=:) +")
• To sort, array.sort_indices() is used (line 675 in the code), just as in my first "sort" publication Sort array alphabetically - educational
aSort = arrT.copy()
sort_Indices = array.sort_indices(id= aSort, order= order.ascending)
• Numbers and text colour will adjust automatically when switching between light/dark mode by using chart.fg_color / chart.bg_color
🔹 DISCLAIMER
Please don't ask me for custom screeners, thank you.
Pesquisar nos scripts por "the script"

Cauchy Distribution Oscillator by c00l75ITALIANO: Questo script è un indicatore che non viene sovrapposto al grafico dei prezzi. Utilizza una finestra di lookback di 14 periodi (che può essere modificata dall’utente) per calcolare la distribuzione di Cauchy per ogni periodo.
La distribuzione di Cauchy è una distribuzione di probabilità continua che viene utilizzata in statistica. Ha una forma simile a quella della distribuzione normale, ma con code più pesanti. Questo significa che ha una maggiore probabilità di generare valori estremi rispetto alla distribuzione normale. E' una distribuzione di probabilità che descrive nel piano euclideo l'intersezione tra l'asse delle ascisse ed una retta passante per un punto fissato ed inclinata ad un angolo che segue la distribuzione continua uniforme.
Nello script, viene utilizzata una funzione che calcola il valore della distribuzione di Cauchy per un dato valore x, utilizzando altre 2 variabili per le quali ho impostato un valore fisso. Il risultato viene quindi memorizzato in un array e la media viene calcolata per tutti i valori nell’array.
E' un oscillatore un po' "estremo", che misura il momentum del prezzo in maniera decisa e per tanto, secondo la mia opinione, va utilizzato di concerto con altri indicatori per poter prendere decisioni consapevoli.
Ad ogni modo se vi piace mettete un "boost" e lasciate un commento se volete altre funzioni o modifiche su questo script.
ENGLISH: This script is an indicator that is not overlaid on the price chart. It uses a 14-period lookback window (which can be modified by the user) to calculate the Cauchy distribution for each period.
The Cauchy distribution is a continuous probability distribution that is used in statistics. It has a similar shape to the normal distribution, but with heavier tails. This means that it has a higher probability of generating extreme values than the normal distribution. It is a probability distribution that describes in the Euclidean plane the intersection of the x-axis and a line passing through a fixed point and inclined at an angle that follows the uniform continuous distribution.
In the script, a function is used that calculates the value of the Cauchy distribution for a given x value, using 2 other variables for which I set a fixed value. The result is then stored in an array and the mean is calculated for all the values in the array.
It is a somewhat "extreme" oscillator, measuring price momentum in a decisive way and therefore, in my opinion, should be used in concert with other indicators in order to make informed decisions.
Anyway if you like it put a "boost" and leave a comment if you want other functions or modifications on this script.

Multiple Moving Average ToolkitFeatures Overview:
Multiple Moving Averages: The script allows you to plot up to five different Moving Averages (MAs) on your chart at the same time. You can choose the type of MA (EMA, SMA, HMA, WMA, DEMA, VWMA, VWAP) and the length of each one.
Color Ribbon: You can turn the MAs into a color ribbon by selecting the "Turn into Color Ribbon?" option. This will make the area between the MAs colored and can help you identify trends more easily.
MA Value Table: You can draw a table on your chart that displays the current values of each MA, whether the trend is bullish or bearish along with the length of the MAs. The current ATR value is also shown in the last cell of the table. You can choose the location of the table (Top Left, Top Right, Bottom Left, Bottom Right) and the transparency of the background color.
Crosses: The script can detect when two MAs cross over each other (1st MA crosses 5th MA and vice versa), indicating a potential trend reversal. It will plot crosses on the chart at the point of the crossover and give an alert if the "Bullish Cross Detected" or "Bearish Cross Detected" condition is met.
How to use:
Once the script is added to your chart, you can customize the settings to fit your preferences. You can choose the type and length of each MA, whether to turn them into a color ribbon, whether to plot crosses, and whether to draw the MA Value Table.
The MA Value Table can be moved to a different location on the chart by selecting the "Location of Table" option and choosing Top Left, Top Right, Bottom Left, or Bottom Right.
Watch for MA crossovers and alerts to identify potential trend reversals. The script can help you identify bullish and bearish trends by color-coding the area between the MAs and displaying the current values of each MA in the table.
Breakdown of the script:
User Inputs
The first section of the script defines several user inputs that allows you to customize the indicator. These include options for turning the MAs into a color ribbon, plotting crosses when there is a bullish or bearish cross of the MAs, drawing a table of the MA values, and setting the transparency of the ribbon. You can also select the location of the MA value table and customize the settings for each individual MA.
Moving Average Calculation
The script defines a function called "getMA" that calculates the moving average for a given type and length. The function uses a switch statement to determine which type of moving average to use, such as an exponential moving average (EMA), simple moving average (SMA), Hull moving average (HMA), weighted moving average (WMA), double exponential moving average (DEMA), volume-weighted moving average (VWMA), or volume-weighted average price (VWAP).
The script then calls this function to calculate the values of up to five different MAs, depending on the user input. The ATR (average true range) is also calculated using the TA library.
Color Filter and Cross Detection
The script sets a color filter based on the relationship between the MAs. If the shorter-term MAs are above the longer-term MAs, the filter is set to green to indicate a bullish trend, and if the shorter-term MAs are below the longer-term MAs, the filter is set to red to indicate a bearish trend. You can adjust the transparency of the ribbon to make it more or less visible.
The script also detects when there is a bullish or bearish cross of the MAs and can generate alerts to notify you.
MA Plotting
The script plots up to five MAs on the chart, depending on the user input. The MAs are plotted as lines with different colors and thicknesses, and you can choose to turn them into a color ribbon if desired.
Cross Plotting
The script plots crosses on the chart when there is a bullish or bearish cross of the MAs. The crosses are plotted as X shapes at the location of the cross and are color-coded to indicate the direction of the cross.
MA Value Table
Finally, the script draws a table of the MA values on the chart, displaying the values of each MA as well as the current trend and the ATR. You can customize the location of the table, and the table is colored to match the color filter of the MAs.
Feel free to message me or comment on the post with any questions or issues!
Much more to come!
Thanks for reading, enjoy!

DeQuex Algo V2The DeQuex Algo V2 script is an advanced technical analysis tool that provides traders with a powerful set of features to help them identify potential trading opportunities in the market. The script is based on the widely used Moving Average Convergence Divergence (MACD) indicator, which is known for its ability to identify changes in trend direction.
The script has several input parameters that can be customized to meet the specific needs of each trader. This flexibility makes it a great tool for traders of all skill levels, from beginners to advanced traders. By adjusting the input parameters, traders can fine-tune the script to their preferred trading style and risk tolerance.
One of the key features of the DeQuex Algo V2 script is its ability to generate buy and sell signals based on MACD crosses. These signals are generated when the MACD line crosses above or below the signal line, indicating a potential change in trend direction. The script also includes options to display trend signals, which can be helpful in identifying the strength of the current trend.
In addition to the MACD indicator, the script also includes a dynamic support and resistance level calculation based on the basis and deviation of the price, as well as volume trend analysis using On Balance Volume (OBV). These features can be used to identify key levels of support and resistance, as well as determine the overall trend direction of the market. This information can be used to make more informed trading decisions and improve the chances of success in the market.
Overall, this script is powerful tool that can be used to help traders identify potential trading opportunities in the market. By using this script in conjunction with other technical analysis tools and fundamental analysis, traders can make more informed trading decisions and increase their chances of success.
Here are the main features of the script:
Moving Average Convergence Divergence (MACD) indicator: The script is based on the MACD indicator, which is widely used by traders to identify changes in trend direction. The script generates buy and sell signals based on MACD crosses, indicating potential changes in trend direction.
Customizable input parameters: The script has several input parameters that can be customized to meet the specific needs of each trader. This includes the sensitivity of the MACD indicator, the source of the price data, the smoothing period, the type of moving average to use, and the display options for trend signals and price bars.
Trend signals: The script includes options to display trend signals, which can be helpful in identifying the strength of the current trend. This can help traders determine whether to enter a trade or wait for a better opportunity.
Dynamic support and resistance levels: The script includes a dynamic support and resistance level calculation based on the basis and deviation of the price. This can help traders identify key levels of support and resistance, which can be used to determine potential entry and exit points.
Volume trend analysis: The script uses On Balance Volume (OBV) to determine the volume trend in the market. This can be used to identify potential changes in trend direction and to confirm the strength of the current trend.
Alert system: The script includes an alert system that can notify traders when a buy or sell signal is generated. This can be helpful for traders who are not able to monitor the market at all times.
Parabolic Scalp Take Profit[ChartPrime]Indicators can be a great way to signal when the optimal time is for taking profits. However, many indicators are lagging in nature and will get market participants out of their trades at less than optimal price points. This take profit indicator uses the concept of slope and exponential gain to calculate when the optimal time is to take profits on your trades, thus making this a leading indicator.
Usage:
In essence the indicator will draw a parabolic line that starts from the market participants entry point and exponentially grows the slope of the line eventually intersecting with the price action. When price intersects with the parabolic line a take profit signal will appear in the form of an x. We have found that this take profit indicator is especially useful for scalp trades on lower timeframes.
How To Use:
Add the indicator to the chart. Click on the candle which the trade is on. Click on either the price which the trade will be at, or at the bottom of the candle in a long, or the top of a candle in a short. Select long or short. Open the settings of the indicator and adjust the aggressiveness to the desired value.
Settings:
- Start Time -- This is the bar in which your entry will be at, or occured at and the script will ask you to click on the bar with your mouse upon first adding the script.
- Start Price -- This is the price in which the entry will be at, or was at and the script will ask you to click on the price with your mouse upon first adding the script.
- Long/Short -- This is a setting which lets the script know if it is a long or a short trade, and the script will ask you to confirm this upon first adding it to the chart.
- Aggressiveness -- This directly affects how aggressive the exponential curve is. A value of 101 is the lowest possible setting, indicating a very non-aggressive exponential buildup. A value of 200 is the highest and most aggressive setting, indicating a doubling effect per bar on the slope.

Bollinger Bands SignalsDescription:
This indicator works well in trendy markets on long runs and in mean-reverting markets, at almost any timeframe.
That said, higher timeframes are much preferred for their intrinsic ability to cut out noise. The example chart is in 3H TF.
Be mindful, the script shows somewhat erratic jigsaw-like behaviour during consolidation periods when the price
jumps up and down in indecision which way to go. Fortunately, there are scripts out there that detect such periods.
You can choose between 4 Moving Averages, Vidya being the default. Period, Deviation and Bands Width parameters
all of them affect the signal generation.
For the Pine Script coder this script is pretty obvious.
It uses a standard technical analysis indicator - Bollinger Bands - and appends it with a 'width' parameter and
a signal generation procedure.
The signal generation procedure is the heart of this script that keeps the script pumping signals.
The BB width is used as a filter.
You can use this procedure in your own scripts and it will continue generate signals according to your rules.

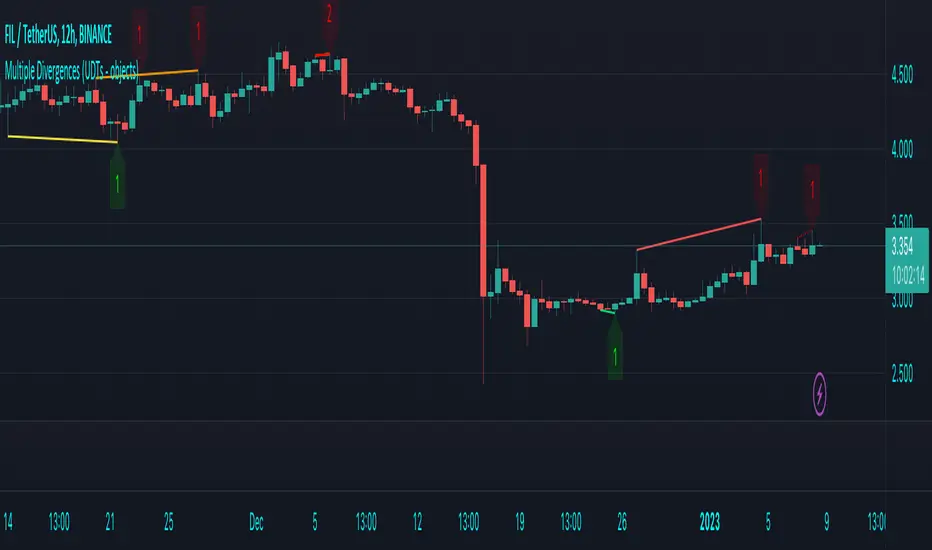
Multiple Divergences (UDTs - objects) - Educational█ OVERVIEW
This script highlights the usage of User-defined Types (UDTs) and objects , and bullish /bearish divergences.
Pivotpoints are used to find divergences, the result of this script will be different against other public multiple divergences scripts.
FOR Pine Script™ CODERS
Besides the information found in CONCEPTS , the comments in the script will, hopefully ), guide you through my thought process.
█ CONCEPTS
The main principle of this script are bullish /bearish divergences, this with 3 different oscillators ( RSI , CCI , MFI )
If you want to know more about divergences, have a look at some Education and Research idea's .
On every bar, an object HLs is made, containing bar_index , high , low , and 2 bool variables ( isPh , isPl ).
On every bar, an object Osc is made, containing bar_index , o (oscillator value), and 2 bool variables ( isPh , isPl ).
If a pivothigh (ph ) is found, isPh will be true on that bar, false otherwise.
If a pivotlow (pl) is found, isPl will be true on that bar, false otherwise.
These objects are added to an array, with limited size.
If a ph is found, the script draws a testline from that ph to every previous ph , found in the array.
Then every high in between these 2 points are checked if they don't pierce the testline .
If the testline isn't broken, the Reg_Div_Piv() function will give 4 values, 1 check (not pierced) variable and the 4 points of the line.
The testline is deleted.
Once a positive check is found, the script will perform the same, but now with the Osc objects.
The script will ONLY compare Osc pivots which are maximum 1 bar away from the high/low pivot .
If everything is confirmed, a line is drawn, visible on the chart.
█ REMARKS
A label will be visible with a number, this is the amount of divergences found with the according oscillator .
EXAMPLE
Div with RSI and CCI -> 2
Div with MFI alone -> 1
Div with RSI and CCI and MFI -> 3
...
Divergences should only be used when confirmed, this is after bar close .
As an aid, lines that are not confirmed will be dotted , if confirmed, they will be solid .
The divergence check start when a ph/pl is found, after which oscillator pivot are checked.
Optionally the same can be done, when a oscillator pivot is found and then check the ph/pl ,
this should give more results, although it can make the script slower.
█ SETTINGS
Left - amount of bars at the left which needs to be lower/higher
Right - amount of bars at the right which needs to be lower/higher
Max values - maximum values in array of objects
3 oscillator settings with
• ON/OFF
• Length
• color bullish divergence
• color bearish divergence
Have FUN !
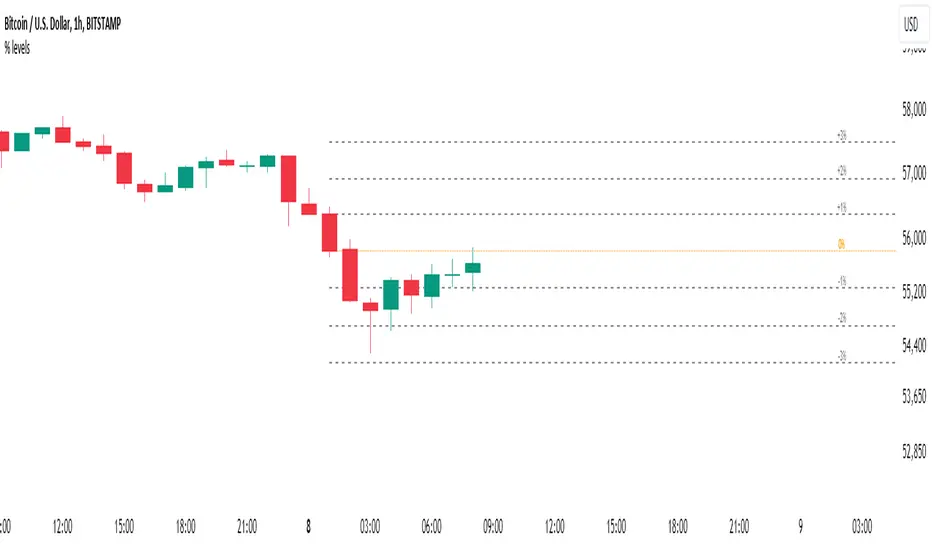
Percent Levels From Previous CloseThis indicator plots on the chart +/- 1% / 2% / 3% ranges based on the previous day's close levels.
Disclaimer :
Success in trading is all about following your trading strategy and indicators should fit into your own strategy, and not be traded purely on.
This script is for informational and educational purposes only. Use of the script does not constitute professional and / or financial advice. You are solely responsible for evaluating the outcome of the script and the risks associated with using the script. In exchange for the use of the script, you agree not to hold monpotejulien TradingView user responsible for any possible claims for damages arising out of any decisions you make based on the use of the script.
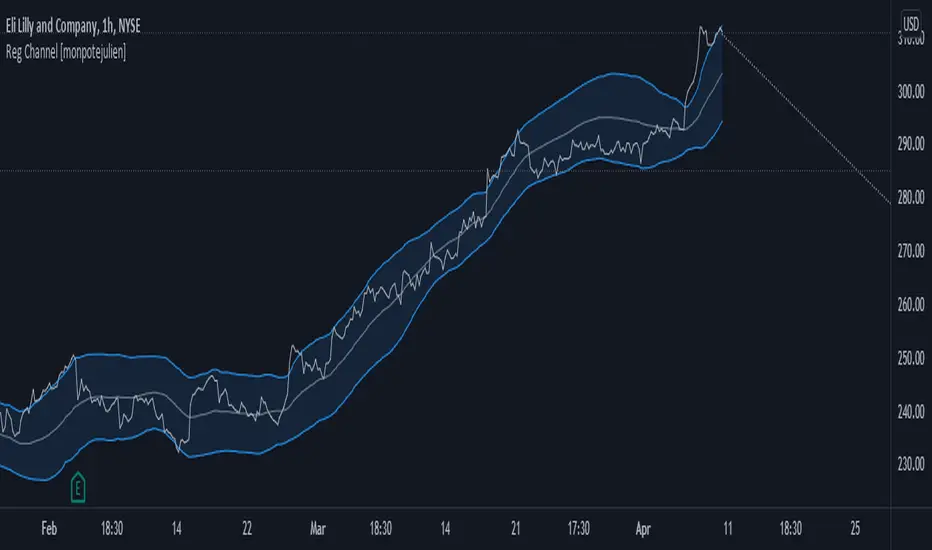
Regression Channel with projectionEXPERIMENTAL:
Auto adjusting regressive channel with projection.
Linear regression is a linear approach to modeling the relationship between a dependent variable and one or more independent variables.
In linear regression , the relationships are modeled using linear predictor functions whose unknown model parameters are estimated from the data.
Disclaimer :
Success in trading is all about following your trading strategy and indicators should fit into your own strategy, and not be traded purely on.
This script is for informational and educational purposes only. Use of the script does not constitute professional and / or financial advice. You are solely responsible for evaluating the outcome of the script and the risks associated with using the script. In exchange for the use of the script, you agree not to hold monpotejulien TradingView user responsible for any possible claims for damages arising out of any decisions you make based on the use of the script.
ZigZag Channel with projection forecastThis indicator is created on top of existing Zigzag indicator .
The projection channel starts at the end of the last ZigZag line.
Disclaimer
Success in trading is all about following your trading strategy and indicators should fit into your own strategy, and not be traded purely on.
This script is for informational and educational purposes only. Use of the script does not constitute professional and / or financial advice. You are solely responsible for evaluating the outcome of the script and the risks associated with using the script. In exchange for the use of the script, you agree not to hold monpotejulien TradingView user responsible for any possible claims for damages arising out of any decisions you make based on the use of the script.

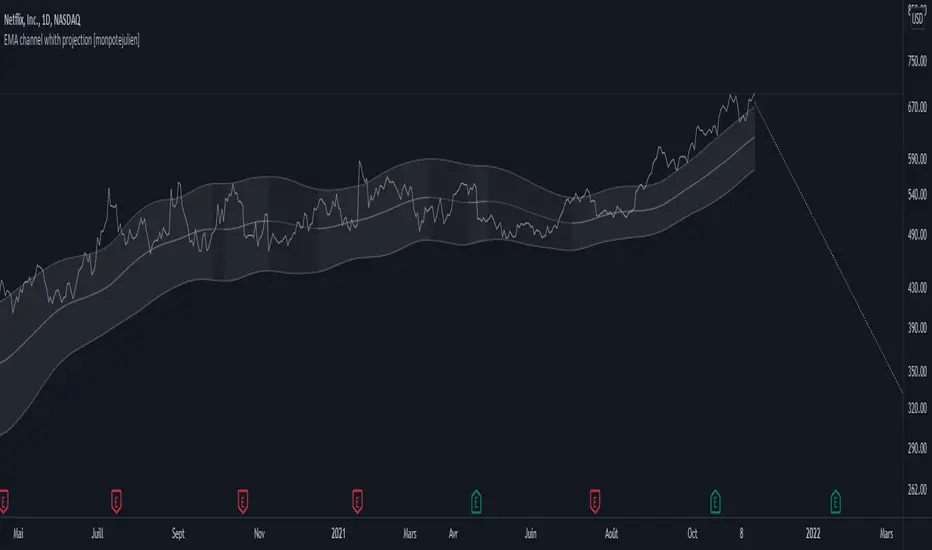
EMA channel with projection forecastExponential Moving Average Channel with projection forecast.
Riding a bull run is almost always riding an EMA value.
This indicator plots displaced EMA values guggesting possible sell targets.
Disclaimer
Success in trading is all about following your trading strategy and indicators should fit into your own strategy, and not be traded purely on.
This script is for informational and educational purposes only. Use of the script does not constitute professional and / or financial advice. You are solely responsible for evaluating the outcome of the script and the risks associated with using the script. In exchange for the use of the script, you agree not to hold monpotejulien TradingView user responsible for any possible claims for damages arising out of any decisions you make based on the use of the script.
[CLX][#04] Progress BarsFully customizable progress bars. 🚥
Functions:
- f_pbar() - 2 color, single argument version
- f_bar_theme() - multi color, array version
A detailed description will follow in the next few days.
Feel free to contribute for an extended version. 😊 Still in development.
We hope you enjoy it! 🎉
CRYPTOLINX - jango_blockchained 😊👍
Disclaimer:
Trading success is all about following your trading strategy and the indicators should fit within your trading strategy, and not to be traded upon solely.
The script is for informational and educational purposes only. Use of the script does not constitute professional and/or financial advice. You alone have the sole responsibility of evaluating the script output and risks associated with the use of the script. In exchange for using the script, you agree not to hold cryptolinx TradingView user liable for any possible claim for damages arising from any decision you make based on use of the script.
TradeChartist Trend Splitter ™TradeChartist Trend Splitter is a visual Trend spotting script based on two simple models fused together - Dynamic Volatility Bands and Dynamic Mean Bands. The fusion of these two models based on user defined parameters of length, Volatility Risk and Mean Bands type, along with optional Trend Splitter color bars and Trend background split will make it visually engaging for any trader to understand the price action.
===================================================================================================================
Trend Splitter User Manual
========================
Trend Splitter settings has option to enable and disable the Volatility Bands and also the Mean Bands.
Under each heading, user can adjust the parameters to suit the trading style, based on time-frame traded.
Volatility Bands track the price action based on volatility trend lookback (Default - 55, MIn - 5, Max - 337) and also uses a Detector plot based on user defined risk (Default is 2.618, Min - 0.618, Max - 5) to continuously track the price action.
Mean Bands track the Mean values of the price action based on TradeChartist's original Mean Reversion Model based on one of 4 time tested Fib Lengths (Default - 55, Options - 55, 89, 144, 233, 337) and detects the price testing of Mean using Orange touchpoints.
Using Price Action in relation to both Volatility Bands and the Mean Bands, the script creates Mean Bands filtered Trend splits that plot Bull or Bear Trend background.
The Mean Bands Filter can be disabled for Trend Splits by just disabling Mean Bands from the settings. Also the option to display Trend Split background can also be enabled or disabled from the settings.
The settings also includes a useful feature to enable or disable coloured price bars using one of 3 colour themes.
Users can create alerts for Price testing mean, Bull and Bear trends using Long or Short from Trend Splitter's Alert Condition.
The indicator doesn't repaint even though a potential repaint warning appears when creating alerts. This can be confirmed by doing bar replay with vertical lines at various lines and trend change zones to get confidence using the indicator. The vertical lines will stay in the same place on both current time and when running a bar replay.
===================================================================================================================
Example Charts
1. 5m chart of BINANCE:AXSUSDTPERP using Trend Splitter (144, 2.618, Normal, 55) and TradeChartist Momentum Drift Oscillator (144 with Drift Visualizer). The Trend Splitter and MDO combo work brilliantly on Lower Time Frames and even on 15s/30s charts with MDO length of 144.
Best Practice - Always wait for a very long trend (over 337 bars on both MDO and Trend Splitter before taking a reverse trend trade at either Exhaustion or Super OB/OS zones of MDO) when using very low time-frames.
2. 5m chart of NYSE:PLTR using Trend Splitter (144, 3.618, Normal, 55) connected to TradeChartist Fib Master to plot Automatic Fibs. Just use Trend Identifier of Trend Splitter from Fib Master signal dropdown from settings, having both scripts active on chart.
3. Daily chart of OANDA:XAUUSD using Trend Splitter (using only Mean Bands - Weighted/144) to spot areas of support and resistance at Mean Bands.
Best Practice - Mean Bands can also act as confirmation indicator when used with other Trading View Indicators like RSI, Stohastic, Bollinger Bands etc.
4. Daily chart of COINBASE:ETHUSD using Trend Splitter (55, 0.618, Weighted, 55) connected to TradeChartist Plug and Trade to show Trend Splitter based Entries with Targets and Past Performance to assess the settings parameters in Trend Splitter. Just use Trend Identifier of Trend Splitter from Plug and Trade signal dropdown from settings, having both scripts active on chart.
===================================================================================================================
Best Practice: Test with different settings first using Paper Trades before trading with real money
===================================================================================================================

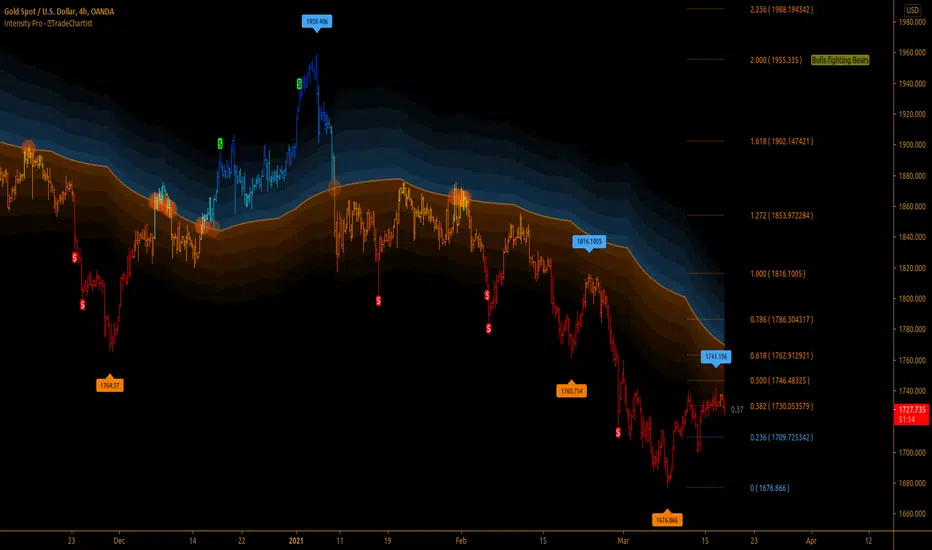
TradeChartist Intensity Pro™TradeChartist Intensity Pro is a visual indicator that comes with 5 Visual Themes and Auto-fibs feature that helps traders with Entry/Exit and levels confirmation based on where the price is, in relation to the Orange Price Equilibrium line and the 5 zones of Bull/Bear limits that fade into the top or bottom outer space.
™TradeChartist Intensity is an original Mean Reversion Model that requires no user input and Intensity Pro incorporates User adjustable Auto-Fibs and manual Fibonacci retracement feature and plots customisable Fib levels along with prices.
======================================================================================
Intensity Pro Features
Orange Mean Equilibrium Line
Bull and Bear Intensity Bands
5 Visual Themes
Trend based Bar Colours
Auto Fibonacci Levels
Custom Auto-Fib Levels
Fibonacci Levels based on Days or Bars Lookback
Current Fib Level label
High and Low Plots
Take Profit Bars
======================================================================================
Example Charts:
1. 4hr BTC-USDT
2. SPX Daily
3. EUR-USD 1hr
======================================================================================
Best Practice: Test with different settings first using Paper Trades before trading with real money
======================================================================================
This is not a free to use indicator. Get in touch with me (PM me directly if you would like trial access to test the indicator)
Premium Scripts - Trial access and Information
Trial access offered on all Premium scripts.
PM me directly to request trial access to the scripts or for more information.
======================================================================================
Snake Trend PremiumThis is an improved version of my original open source snake trend script.
I made this script to reference the current market environment while working on the lower time frames. It combines 8 slow moving averages to calculate the strength of the market trend. It will color the center of the line based on those results. The purpose of it is to visualise a bunch of sma lines into 1 line, it will make it much more organised and gives visual clarity instead of chaos. Do not use this script.
How the snake calculates trend strength for color:
1. It will check for each SMA line if it increased or decreased in value compared to previous candle.
2. An increase means +1 a decrease means -1
3. It will count those numbers to get a strength value ranging from -8 to 8
4. Each specific number is color coded and it will plot that color into the center of the snake based on the color theme selected in config
Configuration:
Show MA Lines = Ability to show the hidden lines used for calculation
5 Color Themes = Includes 5 color themes for the snake of which one based on the original, this is so the user can decide which color theme is most clear.
Plot Snake on other timeframe ? = Ability to plot the visual snake on the timeframe you want instead of current, this will not change the calculation and is only visual.
Use Current Timeframe MACD ? = Chose if you want to use a custom timeframe for MACD (outer skin of the snake line), below that are the standard MACD settings
Use Current Timeframe rsiMFI ? = Chose if you want to use a custom timeframe for rsiMFI (inner skin of the snake line)
Static SMA Length ? = The amount of candles the SMA uses to calculates it's value, standard SMA settings
Timeframe in Minutes SMA 1 = The timeframe line 1 uses (these timeframes are very important as they decide the trend strength calculation which is the backbone of the script. Below that are settings for all the other SMA's
SMA length input changes all lines at once.
The script will get published in 2 ways:
A simple version that will display the trend strength indicator as bars (no overlay)
A version which displays the strength as colors and includes a skin to see if higher or lower TF MACD and rsiMFI are in the negative or positive
Disclaimer:
Never enter a trade purely based on the indicator as it is a trend visualisation but not a good entry trigger.

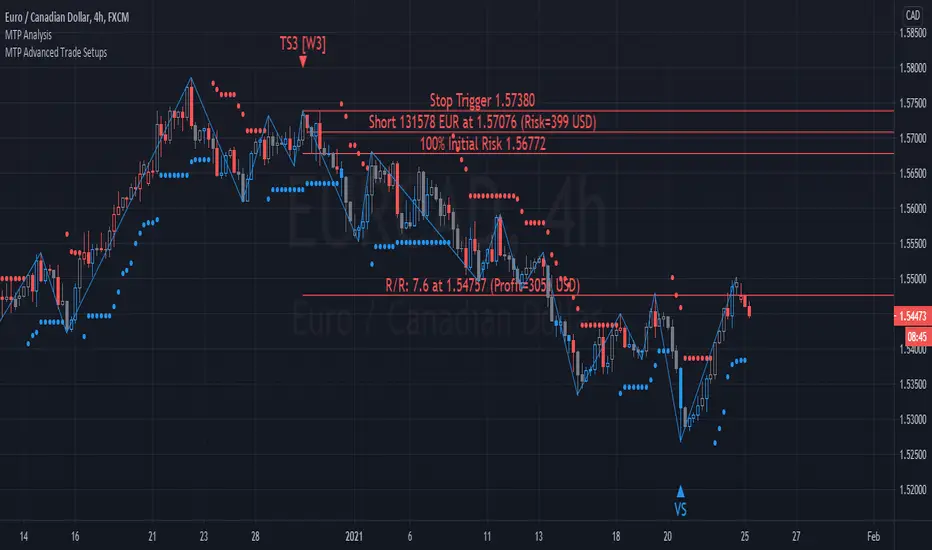
MTP Advanced Trade SetupsThe MTP Advanced Trade setup script contains the Wave 3 variation of MTPredictor automatic trade setups, TS1(W3), TS3(W3), TS4(W3) as well as the Volume Spike (VS) setup.
The TS1(W3), TS3(W3), TS4(W3) trade setups are designed to catch the end of a Wave (2) correction, with the aim of trading the Wave (3) swing. The Wave (3) swing is usually the strongest and longest swing in a completed 5 wave sequence. Whereas, the VS (Volume Spike) setup is designed to identify high volume spikes, with the aim of finding “fake-outs” at levels of DP support/resistance. This is usually where the “professional money” enters the market to produce a sharp swing in the opposite direction. For more detail of the MTP DP level, please visit the publication of the MTP Decision Point (DP) script.
Entry triggers triggers are provided by our MTP coloured reversal bars that are part of our MTP Analysis Script. The triggers are Blue for a potential Buy, Red for a potential Sell, and Grey for Neutral. Please note, these are only relevant at (or up to 5 bars after) the potential trade setup. Please see the MTP Analysis Script for more information.
Targets for the setups are automatically shown for each setup as part of the Trade Analysis. Position Sizing is included in the Analysis as well.
Please remember that although MTPredictor has automatic setups, we do not suggest that you just follow these blindly as if it were a black box mechanical system, judgement is needed in filtering the automatic setups, particularly with respect a clear larger degree trend. Each Trader must take responsibility for deciding on whether their own Analysis is clear and fits in with their own (personal and unique) Trading Plan.
There is a risk in Trading and Investing. Losses can and will unfold.
The script is available as an “invite-only” script, as part of the MTPredictor suite of tools on Trading View.
To obtain access, please go to the web page in our signature that appears below.